• Skip to primary navigation
  • Skip to main content

Cogent QC: Award-Winning Loan Quality Control & Compliance Software

Award-Winning Mortgage Quality Control and Compliance Software

Generic selectors
Exact matches only
Search in title
Search in content
Post Type Selectors

415-495-3660  |  info@cogentqc.com  |  Request Demo

  • Home
  • Company
    • About
    • Why Cogent?
    • Client Success Stories
    • Client Services and Support
      • Professional Services
      • Technical Support
  • Platform
    • Products
      • ProductionQC – Loan Production Quality Control Software
      • ServicingQC – Loan Servicing Quality Control Software
    • Solutions
    • Awards
    • GSE’s, Regulators & Rating Agencies
  • Resources
    • Statistical Calculator
    • Blog
    • White Papers & Articles

Calculate, Streamline and Automate

April 20, 2018 By Kaan Etem


Technology is rapidly transforming mortgage banking. If you went to the MBA Tech18 conference, you saw some of the companies leading the charge. But with enterprise software, change can be slow to arrive. What can you do right now to boost productivity, streamline processes and automate workflows?

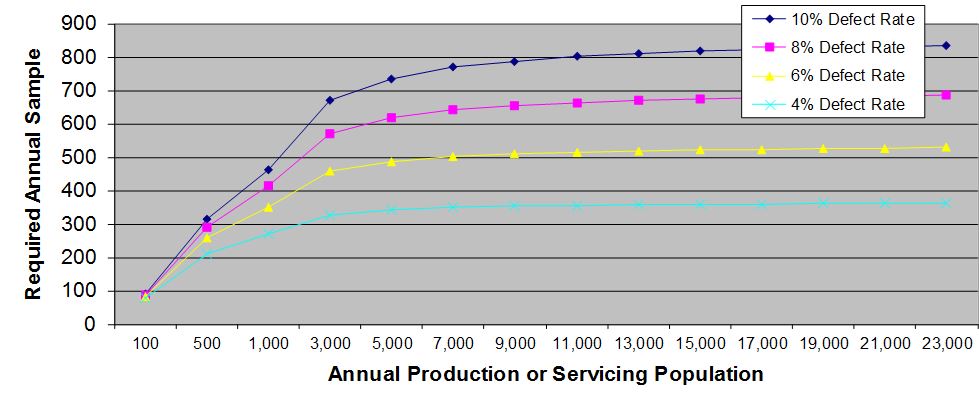
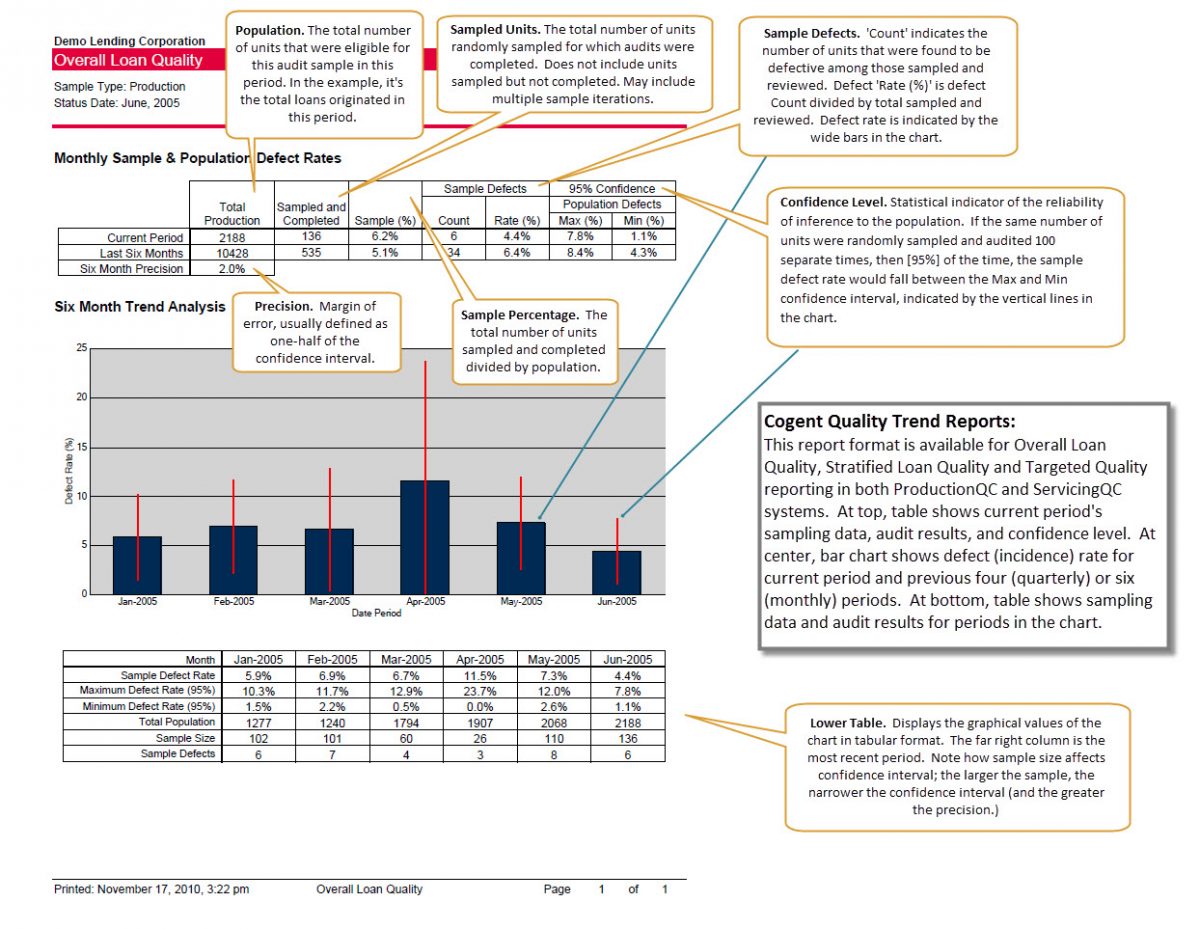
How about optimizing your sampling? Try our statistical sample size calculator and some of our white papers on leveraging statistics. You might get more done with less work. If you’d like to discuss how, contact us.

And while we automate client processes by leveraging Cogent QC Systems tech tools, you may find that revisiting the manual steps in your workflow will be fruitful, especially if that workflow has not changed in years.

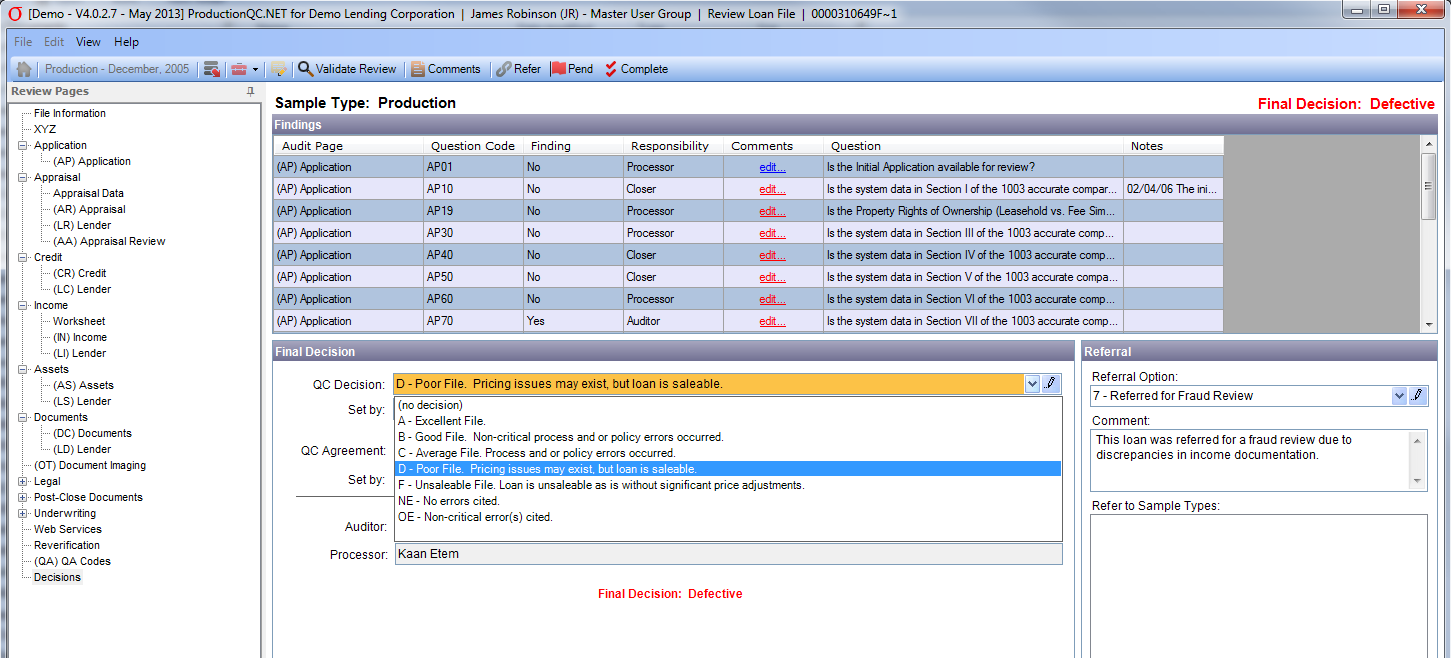
Ultimately, when you’re ready for an adaptable workflow technology for your quality, compliance and risk management, let us know. We’d love to show you the most feature-rich, most customizable system available.

Filed Under: Automation, Business Process, Mortgage Quality Control, Statistical Sampling, Statistics Tagged With: automation

Statistical Sample Size Calculator

March 29, 2018 By Kaan Etem

Our standard statistical sample size calculator is now available as a free resource online. If you haven’t seen it yet, we encourage you to try it.

If you need help, check out the guides and white papers on our Resources page.

And if you have any feedback about how to improve the calculator, let us know. We’re planning an upgrade and we need your input.

Thanks for visiting!

After a population count of about 5,000 units, the number of units to be sampled for any given defect rate flattens out – a major benefit of using statistical sample selection.


The Cogent Team

Filed Under: Mortgage Quality Control, Statistical Sampling, Statistics, Uncategorized Tagged With: Cogent QC Systems, statistical sampling

“Quality Control and the Bottom Line” article by Cogent in Secondary Marketing Executive magazine

February 3, 2014 By Kaan Etem

Quality Control and the Bottom Line

Secondary Marketing Executive magazine has just published in its February issue an article penned by Cogent SVP Kaan Etem on “Quality Control and the Bottom Line.”  The article summarizes much of Cogent’s thinking about efficient and effective quality control, its potential impact on the bottom line, and related commentary on some of the new rules being introduced by Fannie, Freddie, and HUD.  We hope it’s useful.  Let us know what you think.

Filed Under: Business Process, CFPB Testing, Cogent, FHLMC, FNMA, Loan Quality, Mortgage Compliance, Mortgage Industry, Mortgage Servicing, Mortgage Technology, Risk Management, Servicing Management, Statistical Sampling, Statistics, Uncategorized

Do You Know Your Defect Rates?

November 1, 2013 By James Robinson

Fannie Mae announced new quality control guidelines on July 30, 2013 that include a requirement for lenders to track defect rates:

https://www.fanniemae.com/content/announcement/sel1305.pdf
https://www.fanniemae.com/content/tool/qc-defect-rate-tutorial.pdf

Do you know your defect rates?  If not, you will have to implement a process to track them in order to sell to Fannie Mae after January 1, 2014.

Surprisingly, Fannie’s new guidelines say that lenders should report both a “gross” defect rate and a “net” defect rate, (meaning “net” of defective loans that can be fixed.)  Really?  Loans that can be fixed after closing still cost the lender substantially more than loans done right the first time. And what about all the similarly defective loans in the population that weren’t sampled? Consider that an error that can be fixed 30-60 days after close may not be so fixable if the loan goes delinquent 10 months after close and is now a repurchase candidate.  This means you can’t reliably extrapolate from a “net” sample defect rate to “net” population defect rate (interval).

Fannie’s new guidelines also say that lenders should track defect rates by severity, such as “moderate defects” vs. “significant defects”.  This confuses ‘defects’, which are loan-level ratings, with ‘errors’, which are audit question-level ratings.  This is more than just semantics.  The final rating on a loan review should be a binary one:  acceptable or defective.  This is a requirement if statistical sampling is to be used.

Cogent has long asserted that the focus in QC reporting should be on the gross defect rate; this is the rate used to calculate sample sizes in our applications.  Ultimately, the objective of quality control is not to fix defective loans in your samples, but to understand where the defects are coming from and fix the process.

11-1-2013 12-31-41 PM

Cogent clients are able to track gross defect rates with the standard functionality built into both the ProductionQC and ServicingQC applications.  In Cogent’s applications, at the conclusion of each loan review, the QC auditor must assign an overall QC Decision.  The descriptions of the available QC Decisions are controlled by the System Administrator, but each will result in a Final Decision of either Acceptable or Defective, as shown in the screen shot.

Assigning this Final Decision enables users to generate the Cogent Management Reports, which show gross defect rate trends and comparisons, and also to calculate and select properly-sized statistical samples based on the recent 3-period average defect rate for each sample type.

Filed Under: Cogent, Cogent QC Systems, Cogent Software, FHLMC, FNMA, Loan Quality, Mortgage Compliance, Mortgage Industry, Mortgage Quality Control, Mortgage Servicing, Risk Management, Statistical Sampling, Statistics, Uncategorized

Cogent Quality Trend Reports Demystified – Infographic

October 23, 2013 By Kaan Etem

Cogent QC Systems ship with numerous standard reports, organized by category.  Loan Status reports help managers to track the progress of audit activities; Audit Findings reports show audit findings from various perspectives, from granular detail to summary overview, but always for a particular period; and Feedback and Letter reports are designed to track specific audit activities.

In contrast, most Management reports show quality trends across multiple periods for specific sample groups (such as the Statistical Sample or the Stratified Sample, each of which have specific definitions in Cogent.)  In addition, and perhaps most importantly, Cogent’s Quality Trend reports show quality levels for particular sample periods and specify the precision with which these may be inferred to the population.


CogentTrendReport-Infographic

It’s one thing to report the audit results of a selection of loans sampled from a population of loans (“we found 2 defective loans out of the 30 we audited, for a defect rate of 6.7%”); it’s another thing to make inferences, based on the results of the sample, to the population as a whole (“we are 95% confident that the population from which we sampled has a defect rate of 6.7%, plus or minus 2%.)  In order to make valid statements like this, sampling and auditing and reporting must be controlled to eliminate bias and maintain statistical integrity.  Cogent QC Systems do this for you automatically (while providing leeway to separately do non-random, non-statistical sampling.)  The results are presented in Cogent Quality Trend Reports.

Since most clients do not live the dream of statistical analysis on a daily basis, like we do at Cogent, it’s possible that statistical terminology is not top of mind.  So we have created this infographic to help with the interpretation of Cogent’s Quality Trend Reports (click on the image for a larger version).  Please pass the link around among users of Cogent in your organization.  We welcome insights and feedback at support@cogentqc.com.


Filed Under: Cogent, Cogent QC Systems, Data Visualization, Loan Audit Software, Loan Quality, Loan Review Software, Mortgage Auditing Software, Mortgage Quality Control, Mortgage Technology, Risk Management, Statistical Sampling, Statistics, Uncategorized

  • Go to page 1
  • Go to page 2
  • Go to Next Page »
  • Home
  • Products
  • Solutions
  • Clients
  • Blog
  • Tools & Resources
  • Contact Us
  • Terms of Use and Privacy Policy

Copyright © 2025 · Website Design by BizTraffic