Cogent QC Systems ship with numerous standard reports, organized by category. Loan Status reports help managers to track the progress of audit activities; Audit Findings reports show audit findings from various perspectives, from granular detail to summary overview, but always for a particular period; and Feedback and Letter reports are designed to track specific audit activities.
In contrast, most Management reports show quality trends across multiple periods for specific sample groups (such as the Statistical Sample or the Stratified Sample, each of which have specific definitions in Cogent.) In addition, and perhaps most importantly, Cogent’s Quality Trend reports show quality levels for particular sample periods and specify the precision with which these may be inferred to the population.
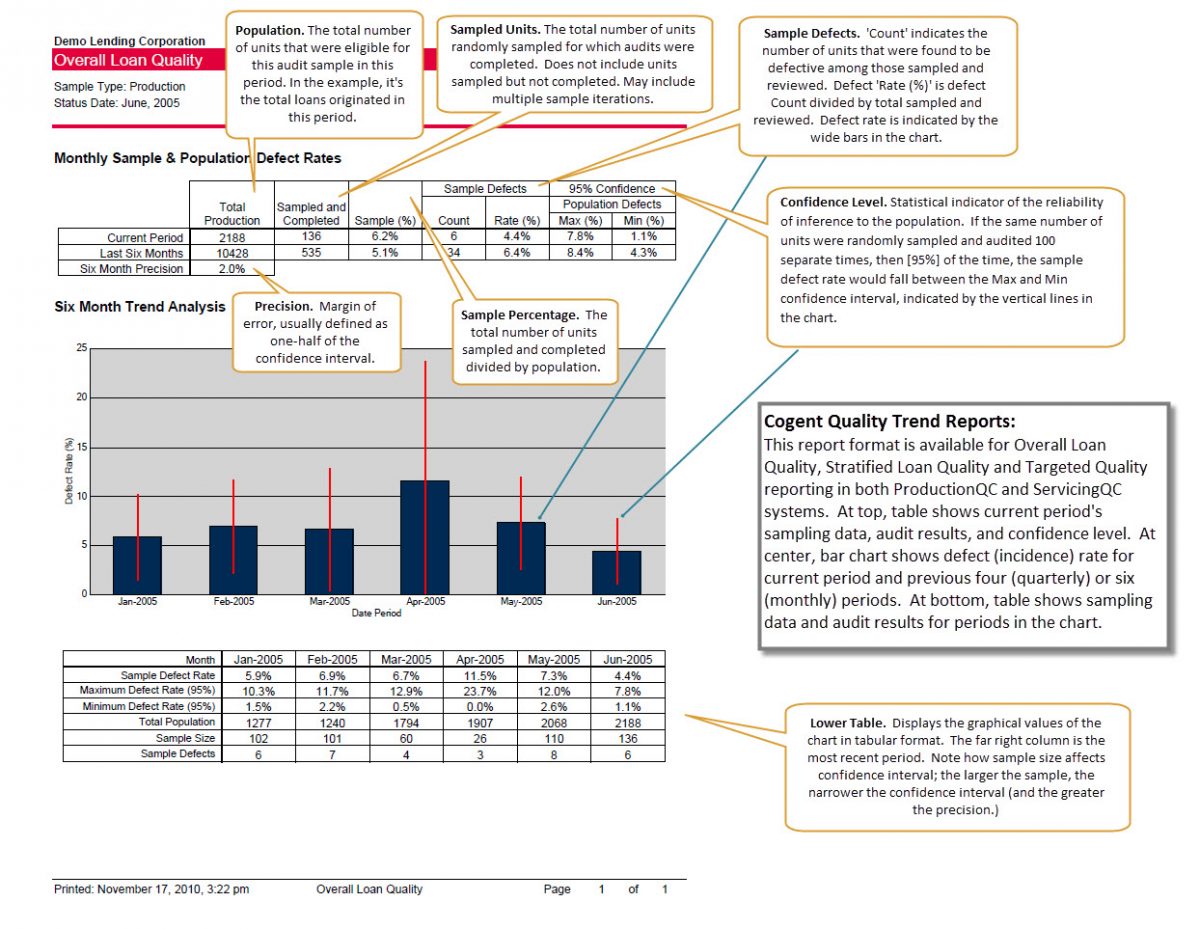
It’s one thing to report the audit results of a selection of loans sampled from a population of loans (“we found 2 defective loans out of the 30 we audited, for a defect rate of 6.7%”); it’s another thing to make inferences, based on the results of the sample, to the population as a whole (“we are 95% confident that the population from which we sampled has a defect rate of 6.7%, plus or minus 2%.) In order to make valid statements like this, sampling and auditing and reporting must be controlled to eliminate bias and maintain statistical integrity. Cogent QC Systems do this for you automatically (while providing leeway to separately do non-random, non-statistical sampling.) The results are presented in Cogent Quality Trend Reports.
Since most clients do not live the dream of statistical analysis on a daily basis, like we do at Cogent, it’s possible that statistical terminology is not top of mind. So we have created this infographic to help with the interpretation of Cogent’s Quality Trend Reports (click on the image for a larger version). Please pass the link around among users of Cogent in your organization. We welcome insights and feedback at support@cogentqc.com.